
In this post, we will investigate the pandas_profiling and sweetviz packages, which can be used to speed up EDA (exploratory data analysis) with Python. In a previous article, we talked about an analagous package in R (see this link).
Getting started with pandas_profiling
pandas_profiling can be installed using pip, like this:
pip install pandas-profiling[notebook]
Next, let’s read in our dataset. The data we’ll be using is a heart attack-related dataset, which can be found here.
import pandas as pd

heart_data = pd.read_csv("heart.csv")

heart_data.head()

Now, let’s import ProfileReport from pandas_profiling.
from pandas_profiling import ProfileReport

report = ProfileReport(heart_data, title = "Sample Report")

report

If you’re running this code in Jupyter Notebook, you should see the report generated within your notebook file.

The report shows several pieces of analysis. First, it gives a summary glimpse of the data, giving the number of variables, observations, missing values and percentages, data type information, and number of duplicate rows (if any).
Additionally, there are several other tabs available in the report. For example, the package automatically generates correlation heatmaps, like below. Also, it’s possible to see how many missing values the dataset has by column.

The variables tab shows the number of distinct values, missing values, and plots a histogram or barplot for the variable (for numeric or categorical variables, respectively).
If you want to save the report to an external HTML file, you can do that by using the to_file method.
# save report to file
report.to_html("report_file.html")
Handling larger datasets
Handling larger datasets is more of a challenge using the default settings, but can be done by making some adjustments. The ProfileReport class comes with a parameter called minimal, which we can set to True to reduce the number of computations that will be made.
This setting will generate a report showing the Overview and Variables tabs, so you can still see a visualization of each variable, missing value analysis, and a few summary stats.
min_report = ProfileReport(heart_data, title = "Minimal Report", minimal = True)

min_report
If you want to run the full profiling on a large dataset, it may be better to start with a sample to avoid computational issues.
The sweetviz library
An alternative to pandas_profiling is the sweetviz, which can also generate an automated EDA report. We can install sweetviz using pip:
pip install sweetviz
Similar to pandas_profiling, you can generate an EDA report using a short code snippet:
import sweetviz as sv

# generate report
sweet_report = sv.analyze(heart_data)

# show the output
sv.show_notebook()
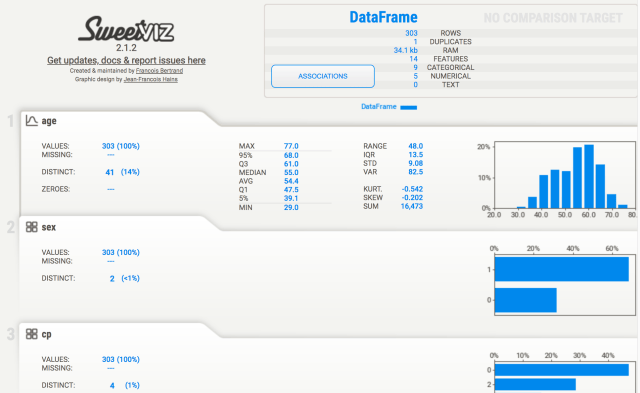
You can click on a tab for any of the variables to expand the analysis done on any variable. This analysis shows descriptive statistics, a histogram (or barplot) of the variable’s distribution, and information around the most frequently occurring values. Additionally, sweetviz generates a heatmap showing the associations between the variables in the dataset. Between continuous variables, this heatmap shows the Pearson correlation coefficient. For continuous and categorical features, the correlation ratio is shown. The uncertainty coefficient is shown for categorical-to-categorical associations.
The show_notebook method above generates the report within Jupyter Notebook. If you want to create an external HTML file, you can use show_html, like this:
sv.show_html()
Comparing datasets with sweetviz
Sweetviz can also be used to compare two datasets. For example, if you want to compare training and validation datasets, you could do that with sweetviz.
compare_report = sv.compare([train_data, "Train"], [val_data, "Test"], "output")

# show output within notebook file
compare_report.show_notebook()
This report will be similar to the one above, except it will break out the analysis by each dataset.
Conclusion
That’s all for now! If you enjoyed this post, please share it with your friends. To learn more about the packages discussed in this post, check out these links: